
Written by :
Published on :
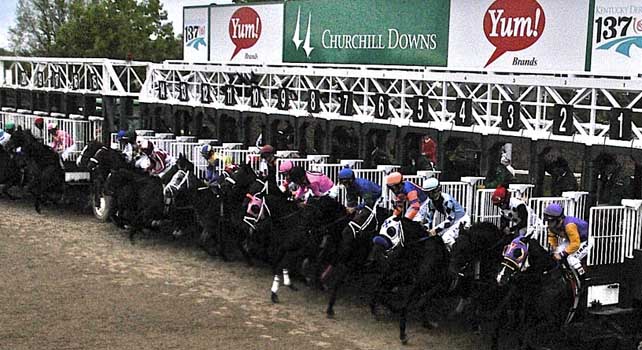
Unlike the Preakness Stakes and Belmont Stakes, the Kentucky Derby post position draw tends to be more critical.
Get a 50 Percent Cash Bonus and Up to 8% Daily Cash Rebates on your Racebook Action at BetDSI.com
Position in the gate is paramount to getting a good trip and securing a favorable running position in a race that includes up to 20 entries.
Inside post positions are not always beneficial in the Kentucky Derby as 15 other horses jostle for the inside rail and have a tendency to push around horses already there.
Trainers, jockeys and owners these days tend to wish for post position draws between 5 and 15, with 14 and 15 often considered ideal.
While it’s true that nineteen horses have won from post positions number 1 through 3 between the years 1930 and 1987, only one entry has done so since. The outside gate has had especially good success in recent years including last year’s Triple Crown winner American Pharaoh (post position 15).
Let’s look at the full breakdown since the dawn of the Derby and since 1999.
|
Post Position |
Most Recent Winner |
Wins/Starts |
Win Percent |
Wins/Starts Since 1999 |
Win Percent Since 1999 |
|
1 |
Ferdinand (1986) |
8/86 |
9.3% |
0/17 |
0% |
|
2 |
Affirmed (1978) |
7/86 |
8.1% |
0/17 |
0% |
|
3 |
Real Quiet (1998) |
5/86 |
5.8% |
0/17 |
0% |
|
4 |
Super Saver (2010) |
5/86 |
5.8% |
1/17 |
5.9% |
|
5 |
California Chrome (2014) |
9/86 |
10.5% |
3/17 |
17.6% |
|
6 |
Sea Hero (1993) |
2/86 |
2.3% |
0/17 |
0% |
|
7 |
Street Sense (2007) |
6/85 |
7.1% |
1/17 |
5.9% |
|
8 |
Mine that Bird (2009) |
8/85 |
9.4% |
2/17 |
11.7% |
|
9 |
Riva Ridge (1972) |
4/82 |
4.9% |
0/17 |
0% |
|
10 |
Giacomo (2005) |
9/79 |
11.4% |
1/17 |
5.9% |
|
11 |
Winning Colors (1988) |
2/75 |
2.7% |
0/17 |
0% |
|
12 |
Canonero II (1971) |
3/71 |
4.2% |
0/17 |
0% |
|
13 |
Smarty Jones (2004) |
4/69 |
5.8% |
1/17 |
5.9% |
|
14 |
Carry Back (1961) |
2/61 |
3.3% |
0/17 |
0% |
|
15 |
American Pharoah (2015) |
5/54 |
9.3% |
3/17 |
17.6% |
|
16 |
Animal Kingdom (2011) |
4/45 |
9.3% |
3/17 |
17.6% |
|
17 |
N/A |
0/37 |
0% |
0/16 |
0% |
|
18 |
Gato Del Sol (1982) |
1/29 |
3.4% |
0/15 |
0% |
|
19 |
I’ll Have Another (2012) |
1/24 |
4.2% |
1/12 |
8.3% |
|
20 |
Big Brown (2008) |
1/14 |
7.1% |
1/6 |
16.7% |
RANKING THE KENTUCKY DERBY POST POSITIONS OVER THE LAST 15 YEARS BY BEST AVERAGE FINISH
1. Post 8: Average finish -- 7.7 with two firsts (Mine that Bird, 2009 and Barbaro, 2006), one second, two thirds.
2. Post 5: Average finish – 7.8, three firsts (California Chrome, 2014; Funny Cide, 2003 and War Emblem, 2002) one second, one third.
3. Post 2: Average finish – 7.9, two seconds and four thirds.
4. Post 16: Average finish – 8.5, two firsts (Animal Kingdom, 2011; Monarchos, 2001), one second, one third.
5. Post 13: Average finish – 9.1, one first (Smarty Jones, 2004), two seconds, one third.
6. Post 20: Average finish – 9.3, one first (Big Brown, 2008).
7. Post 4: Average finish – 9.5, one first (Super Saver, 2010), two thirds.
8. Post 11: Average finish – 9.6, one second.
9. Post 18: Average finish: -- 9.76, two seconds.
10. Post 3: Average finish – 9.8, two seconds, one third.
11. Post 7: Average finish – 9.9, one first (Street Sense, 2007).
12. Post 14: Average finish – 10.3, one third.
13. Post 9: Average finish – 10.47, no top three finishes.
14. Post 15: Average finish – 10.53, two firsts (Orb, 2013; Fusiachi Pegasus 2000), one second.
15. Post 12: Average finish – 10.53, one second, one third.
16. Post 1: Average finish – 11.1, no top three finishes.
17. Post 10: Average finish – 11.1, one first (Giacomo, 2005), one third.
18. Post 17: Average finish – 12, no top three finishes.
19. Post 6: Average finish 12.1, one second.
20. Post 19: Average finish 13.7, one first (I'll Have Another, 2012).
- Don Shapiro, Gambling911.com


